
Historically, data about state repression/human rights violation (coercive activities undertaken by political authorities against those within their territorial jurisdiction) has been compiled by governments, human rights organizations and newspapers. While this has yielded a tremendous amount of information, it has also proved quite limiting. For example, there is very little information about repression before human rights organizations came into existence and/or before human rights became something that governments recorded – i.e., pre-1976. There is no source material to compare against these sources. Additionally, there is constant attention given to the fact that many events are commonly missed. – frequently attributed to problems with victims and witnesses being unable to get their message out. How can we improve this situation?
In 2010, I created The Illustrative Information Interface (III) to allow all individuals from all walks of life to provide as well as use relevant information in an easy, user-friendly manner on the internet or via some hand-held device. As designed, individuals (victims, witnesses, refugees, scholars, students, travelers as well as ngos, journalists, and government personnel) could give information about what they have heard, seen or read about and contribute this information to the III. This information could then be used by others who are interested in the relevant topic to increase their awareness, to conduct analyses or compare against other data sources.
Facilitating the broadest access possible, the process of entry was simplified. III users simply
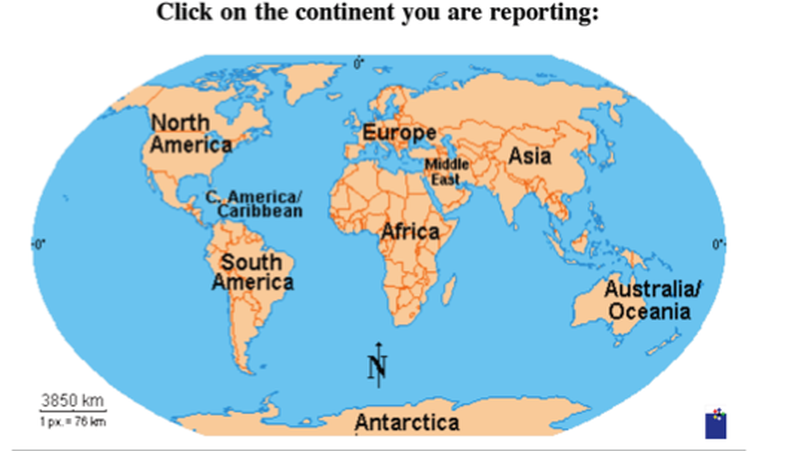
- logged into the web page and selected the country that they are interested in reporting about
- whether or not they wished to discuss the country overall or a specific region
- if the latter, a listing of regions came up.
- Individuals were promoted to specify which years they were aware of and wanted to report on.
- This then led to only those years coming up on the screen.
- Individuals were then prompted to enter in the scope (% of the population influenced) and “severity”(degree of violence involved) with repression - which were both hyperlinked to definitions. Both of these were provided on scales of 0 to 100.
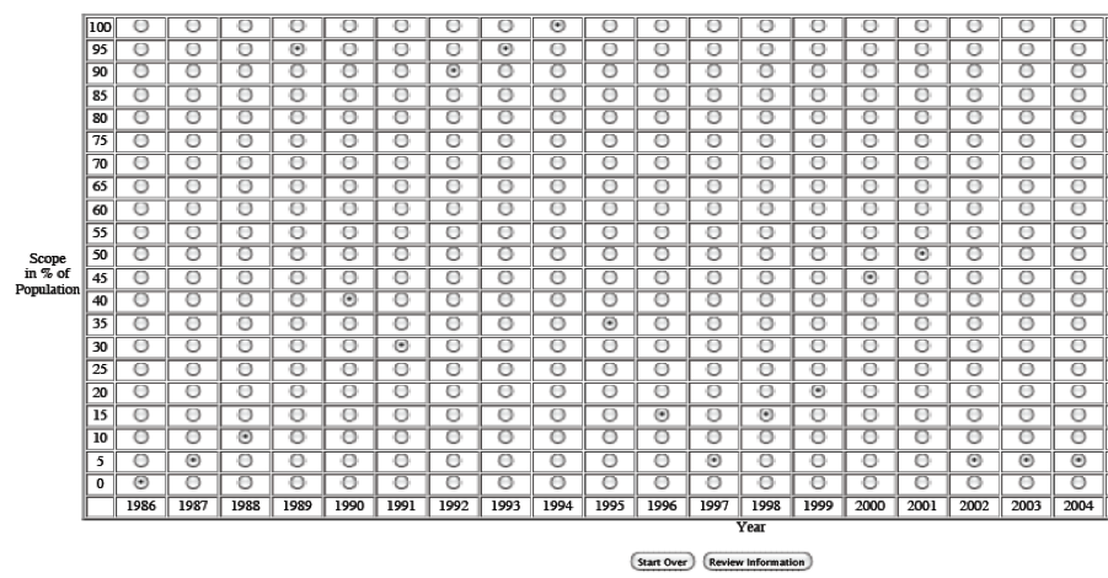
After the respondent entered information, their entry was converted into a figure, which the respondent could manually drag upwards or downwards to correct the general trend/line. Once they were satisfied, they would push return and be shown the following screen.
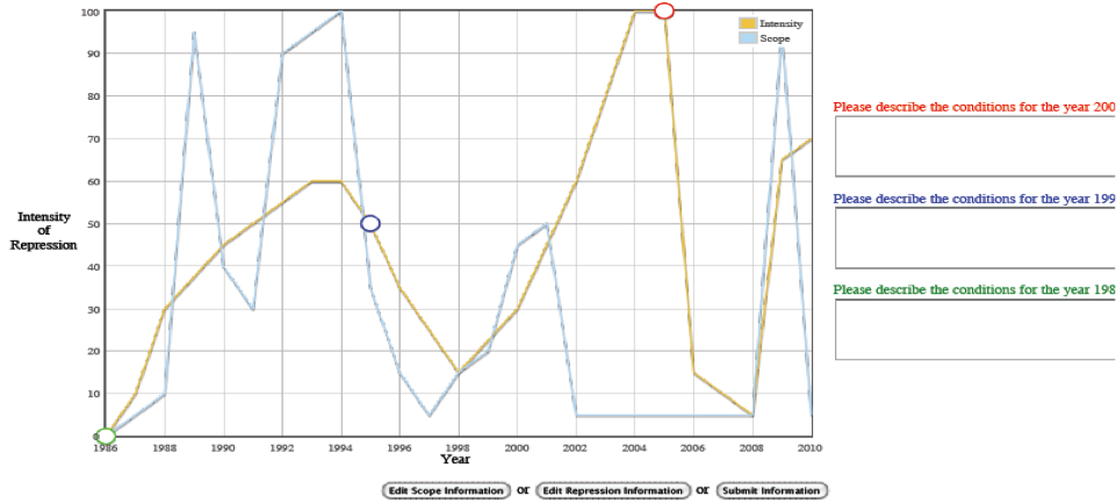
When the image came up, the respondent would be asked to describe the lowest, median and highest points for the respective phenomenon being recorded. This was an attempt to get a better understanding of what they had in mind when they entered the particular values that they did - a coarse way to get at vignettes.
When the respondent was finished with their entry, they were asked a series of questions. This information can then be used by others in order to explore exactly what happened (i.e., how much of the population was targeted and at what level of severity). Herein lies another innovation in that the III allows the interested party (researcher/journalist/student) to select who they most trust as well as compare across distinct information providers. For example, if one only wants to trust those who spent 10 years in the country, they can do so a s well as compare them against those that never visited. If one only wants to trust individuals without a PhD, the can do so and compare this source against those without a PhD. What results is a dynamic, interactive, transparent and far-reaching information collection procedure.
When the respondent was finished with their entry, they were asked a series of questions. This information can then be used by others in order to explore exactly what happened (i.e., how much of the population was targeted and at what level of severity). Herein lies another innovation in that the III allows the interested party (researcher/journalist/student) to select who they most trust as well as compare across distinct information providers. For example, if one only wants to trust those who spent 10 years in the country, they can do so a s well as compare them against those that never visited. If one only wants to trust individuals without a PhD, the can do so and compare this source against those without a PhD. What results is a dynamic, interactive, transparent and far-reaching information collection procedure.
Questions & Answers
- Why did I just allow anyone to enter information?
- Well, I do not necessarily trust anyone who considers themselves an expert and I concluded that experts and your ability to find them were largely a function of network. This would introduce some bias into the project and I did not want to do that. I thus considered anyone who wanted to provide information an "expert" and allowed the user to explore "expertness" as they desired.
- How many entries were required before a country would "go live" (i.e., be available for people to look at)?
- We came up with 50 initially but then lowered this to 30 at the nation-state level. We required 5 for a specific geographic sub-national unit to go live.
- How did we try to find people?
- Essentially, we relied upon two sources. First, we tried to use the network affiliated with the University of Notre Dame in Central and Latin America who had interests in human rights violations and state repression. Second, we tried to reach out to area experts in Universities, human rights NGOs throughout the globe as well as at annual research meetings around the globe.
- How did recruitment go?
- Horribly.
- The pitch might have been a little dry in the electronic and snail mail version:
Dear Professor X
My name is Christian Davenport at the Kroc Institute - University of Notre Dame and I write to you because I have recently created a research and advocacy project that could benefit from your assistance. In an effort to better identify, monitor and understand human rights violations and state repression, I created something called the Illustrative Information Interface (hereafter III). In 15 minutes, you could help advance this effort tremendously.
As you know, historically data about human rights violation and state repression (coercive activities undertaken by political authorities against those within their territorial jurisdiction) has been compiled by governments, human rights organizations and newspapers. While these sources have yielded a tremendous amount of information, they have also proved to be quite limiting. For example, there is very little information about repression before human rights organizations came into existence and/or before human rights became something that governments recorded – i.e., pre-1976. There is no source material to compare against these sources. Additionally, there is constant attention given to the fact that many events are commonly missed – frequently attributed to problems with victims and witnesses being unable to get their message out.
How can you help us improve this situation? III is a program designed to allow all individuals from all walks of life to provide as well as use relevant information in an easy, user-friendly manner on the internet and later via some hand-held device. III is not just seeking information about current abuses and activities but any information that you have about any activities, past as well as present. As designed, individuals (victims, witnesses, refugees, scholars, students, travelers as well as ngos, journalists, and government personnel) can give information about what they have heard, seen or read about and contribute this information to the III. This information can then be used by others who are interested in the relevant topic to increase their awareness, to conduct analyses or compare against other data sources.
As a way to launch the project and establish a core around which others can provide information (i.e., anchors), I am contacting approximately 30 individuals that have written about the relevant topic within countries of North, Central and South America. From your earlier work, you have been identified as someone that has information about repression and human rights violation in Cuba. If we could get about 15 minutes of your time, you could greatly assist us in advancing our knowledge about what took place and make this information available to the world.
To begin, simply go to https://iii.nd.edu, enter the site, click the following:
- "begin using iii"
- "enter information"
- "continue" (past the selection of the type of behavior under examination)
- "continue" (past the definition of repression)
- enter the user verification
- and, then enter the following code (7tfnkmi8y42) at the bottom of the "contact information"
Sorry about the complexity but there are various security protocols that have been built into the program to protect the identity of the person entering information.
After the passcode has been entered, you will be prompted to use iii. Simply read the instructions and provide any information that you have. A short youtube video has been created to show you have to use the program if needed (https://iii.nd.edu/guide.html?). As an initial contact of III you are allotted 250 additional codes that you can give to others you think would be qualified to provide useful information. After your code has been introduced, you are able to generate these from the next page after entering.
If you have any questions at all, please feel free to contact me. Thank you in advance for your participation in III and providing some much needed insight into one of the greatest problems confronting humankind.
Christian Davenport
The post card was a bit cooler.

This effort at outreach I also liked:
- Why was recruitment so poor?
- Essentially, we had a mismatch of technology and personnel. We had a relatively high-tech way of extracting information from people and a group of people who were not exactly comfortable using technology. Quite frequently we ended up with a female student and an iPad walking some senior male professor, lawyer or activist through the program. This frequently did not work out well.
- The following evaluation after a meeting at the Latin American Studies Association meeting proves informative:
Overall impression of the experience of iii at LASA
General comments: the experience of iii at LASA was not very positive.Conference participants were reluctant to participate in the interviews. It was not the best venue to present the project, since attendees do not have time (or say they do not have time) to interview and prefer to spend their time networking.
- The venue (LASA) may not be the most adequate venue for this type of interviewing. People go to this meeting for two/three days of intensive networking. Experts on the topic (academics and nonacademics) don't necessarily have time/want to be bothered with answering this questionnaire. The breaks between sessions were too brief and people were generally trying to network with colleagues and were thus not particularly interested in taking 15-20 minutes out of their day to chat with us.
- It was difficult to convince non-experts that their input on repression is of interest to us.
- Graduate students and junior scholars are more understanding/sympathize with us, but slightly older ones tend to be less receptive.
- People were not convinced by iii. They tended to be very doubtful about the quality of the data. Some thought that, since non-experts were also contributing to the iii, the information we are collecting is ofno real value. Some of them openly commented that they did not think we would get enough observations for each year to cancel out the errors.
- Many respondents thought it was extremely difficult to quantify scope and severity, and some even felt “offended” with the idea of talking about violence and human rights in terms of percentages.
- Individuals not accustomed to working with survey research methods or cartesian graphs seemed to be dismayed with the scope/severity ratings and felt dissatisfied with the lack of specificity.
- Some respondents had trouble answering the questions because they were experts in violence against specific groups, and they did not know how to contribute to the iii.
What was achieved
We managed to raise the profile of iii. Despite failing to complete the intended number of interviews, we did speak to many conference participants about the project and passed out quite a few postcards. Hopefully, this means that scholars will explore the website and perhaps even complete an interview on their own time.
What was not achieved
The number of interviews was below expected. However, the few interviews conducted by our group provided good feedback about some problems with iii. There was a general sense of frustration regarding how difficult it was to get people to participate in the project.
What did not work
- Registering information: People generally do not want to provide all their contact information. Because we could tell them how not to include contact information they did not want to provide, the interviews could move on. However, if the platform does not tell them that they can just write “n/a” or “0000” in the items they do not want to provide, it is likely that, when independently answering a questionnaire, those respondents who prefer to withhold personal information will give up on the interview.
- Pre-arranging interviews was not successful. Nor was approaching people randomly throughout the conference successful. The rate of return for both tactics was far below what it should have been given the amount of effort required to gather email addresses and approach people repeatedly to no avail.
- Sometimes the system did not allow them to go back and review their assessments of repression (scope or severity) for a particular year. [An error screen would appear; in one such case, the other resulted in my having to restart the interview].
- The measure of severity was very difficult to understand, particularly since respondents argued that not all sectors of repressed populations are subject to the same level of repression severity, and the instrument does not allow for the nuances they wish for.
Suggestions for how things could be improved in the future
- A more formalized approach might work better. For example, renting a booth in the book exhibit that is fully staffed with people with iPads able to
interview scholars as they meander through the booths might be more effective. Individuals walking through the book exhibit obviously have
some time to spare so they may be more inclined to lend their time to the project. Alternatively, iii could be presented in a special workshop or something of the sort. A more formal presentation can probably reduce the amount of skepticism perceived from respondents surrounding the project. - Remove the mandatory personal information feature. Consider making the input of minimal personal data a post-survey feature.
- The project should go viral. Before that happens (in the optimistic scenario) an alternative is to distribute the link to a re-worked version of the project description via email to key academics and activists. Perhaps try to get a few "nodes" to answer the project, know it, get excited about it, and see if that helps get the ball rolling, via internet. I wonder if the pitch should be different for academics than for non-academic types.
- The website address should stand out and be clearly and quickly identifiable in the flyer. Right now it’s not! People glanced at the
flyer and didn't see the website. - The flyer should be more explicit about how the data will be used and available. And it should be clearer about who is behind the
project. I think people who are answering this would appreciate that.
- Why did V-DEM and later the Human Rights Measurement Initiative succeed where III failed?
- Frankly, I think these two projects used a more simplified and straightforward conception of experts. These projects relied upon a survey and not some complex interface. They were better able to mobilize support from their networks - clearly the former more than the latter. Finally, when Christian Davenport left the University of Notre Dame to go to the University of Michigan, the technical expertise did not go with him. To create the program, Davenport had worked closely with Timothy Wright and Harold Rowe in the Center for Research Computing at the University of Notre Dame. Without this support, he was left with trying to recreate the project without the proper technical assistance.
- Why did III use the interface that they did?
- Well, the idea came to Davenport when in the field trying to talk to someone about human rights violations in some country. The person he was talking to was a historian and expressed that they were uncomfortable with numbers and Davenport pulled out a pen, drew a trend line on a napkin and then asked the person whether this accurately captured what they had just been talking about. Adjusting a few years upwards and one downwards, he said yes and Christian thought that he had discovered a reasonable way for qualitative and quantitative scholars to communicate. Actually, the project was first called the qualitative-quantitative interface.
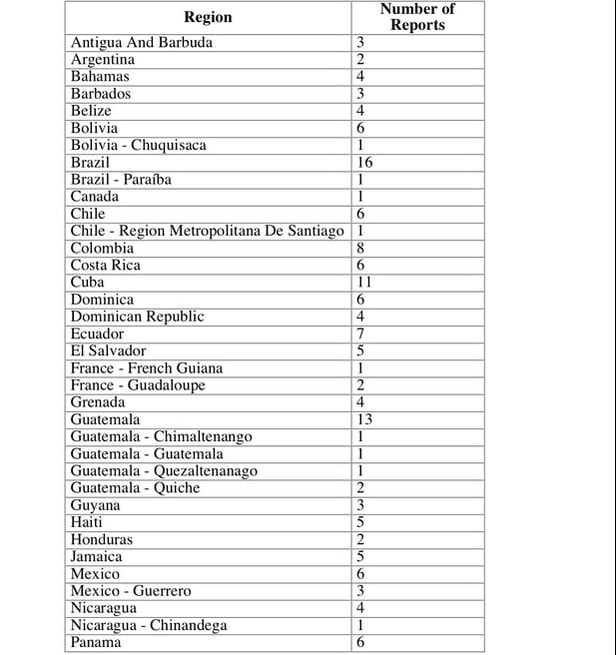
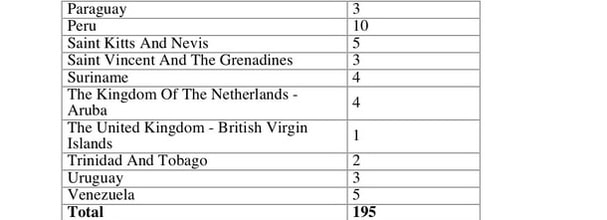
- Was any data collected in the end?
- Yes, in the end III ended up with 195 entries covering 36 countries. We are in the process now of trying to put this all together for a paper. The framing of a failed project is a little difficult to get behind though.